A core Strong Towns principle is that financial solvency is a prerequisite for long-term prosperity. Us at Strong Towns Blono want to add some transparency to the usually opaque municipal financial landscape. A strong fiscal health is key to creating stronger towns, and learning from our mistakes of suburbanization can help us improve city services for everyone down the line.
Every year, municipalities release an Annual Comprehensive Financial Report, which is completed in a standard format for all American and Canadian cities according to agreed-upon government accounting practices. That makes it easy for the national organization of Strong Towns to create a tool to analyze these documents and chart the topline numbers in a way that the general public can understand. We’ll inspect the results for both Bloomington and Normal, give our commentary. Afterwards we’ll describe how we found these numbers, and what our communities should do to in order to improve their financial standings into the future.
Findings

How Did We Get Here?
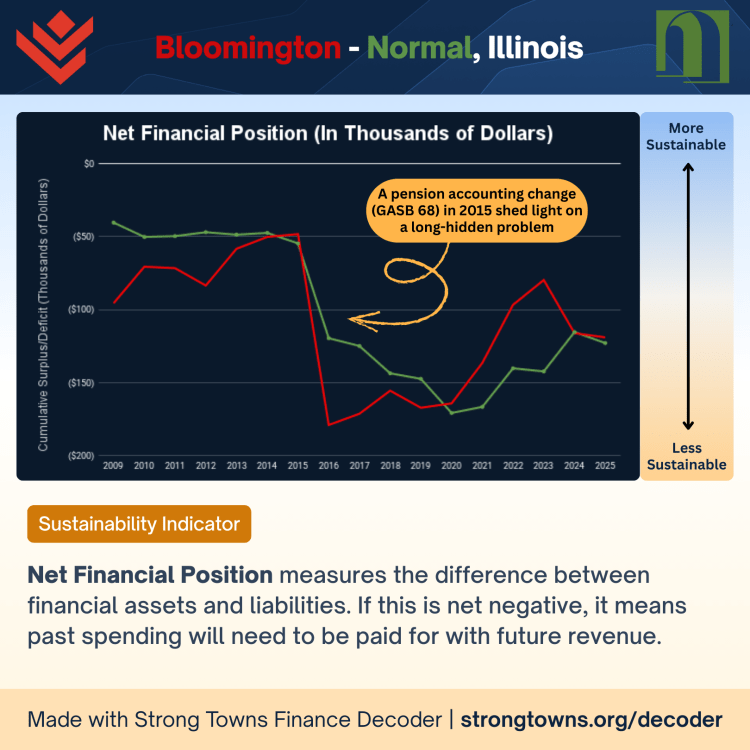
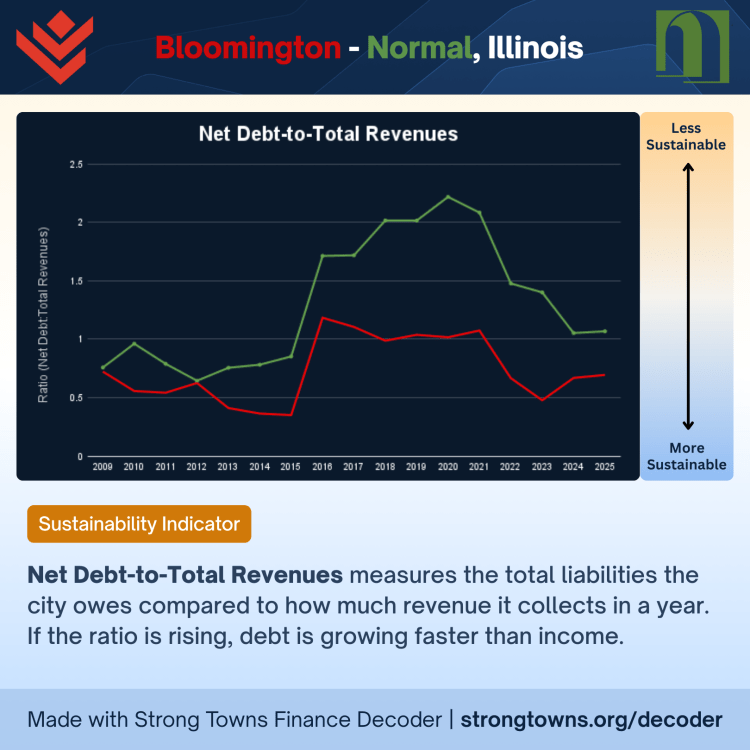
The first chart on Net Financial Position is pretty straightforward and concerning, however not out of line with nearly all other American cities of our size. Simply put, we have past obligations that we have to pay for using future revenues. There was an accounting standards change (GASB 68) that occurred in 2015, which meant that cities had to include pension obligations for city workers in the topline numbers of the ACFRs. The numbers before and after this change are stark.
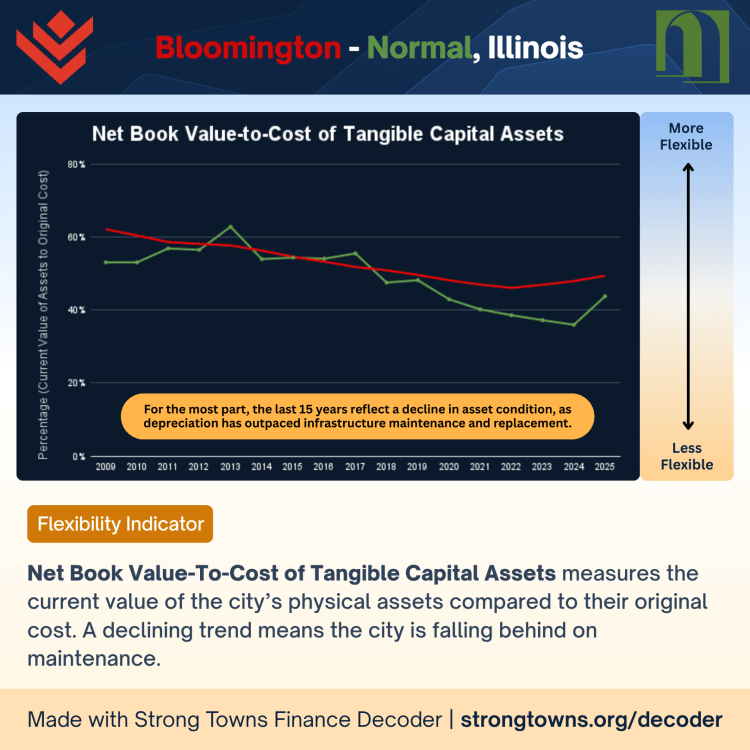
The second chart, Net Book Value-To-Cost of Tangible Capital Assets, shows our communities continually struggling to keep up with general maintenance. These capital assets include everything from police cars, snow plows, parks, government land and buildings, and importantly infrastructure like streets and water systems.
Both communities have made decisions that have brought us here today. Even if Bloomington or Normal never actually default on their bonds, they can still “default” on residents: crumbling roads, slowed snow removal, neglected parks, understaffing, and the overall rollback of effective governance.
Charles Marohn, the founder and president of Strong Towns national, argues cities run out of money for a simple reason: they built places that cost more to take care of than they ever earn back. After World War II, many cities spread out with wide roads, parking lots, and low-density development (known as “The Suburban Experiment”). This is cheap to build at first, but very expensive to maintain over time (streets, pipes, sewers, lighting, and services all need perpetual repair & funding).
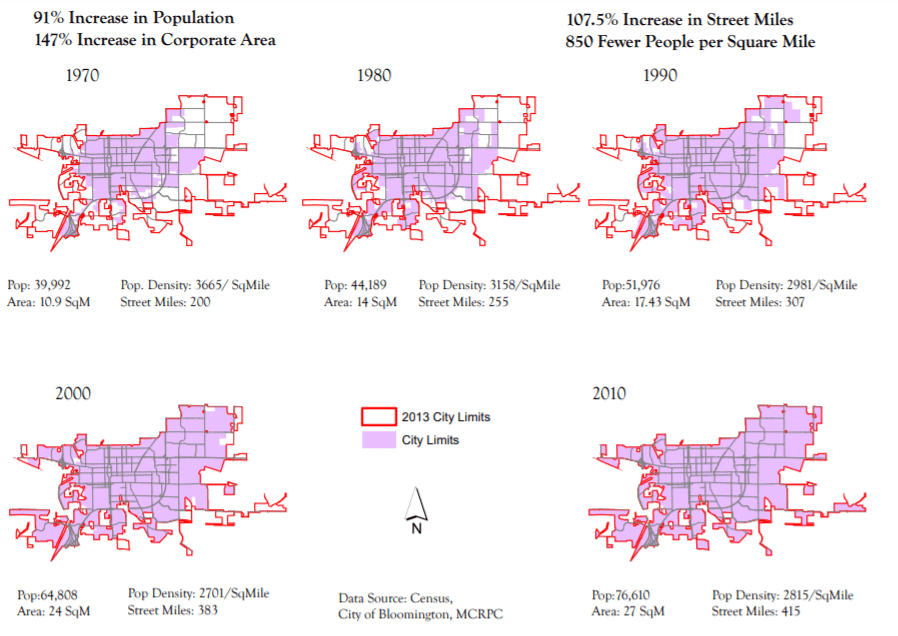
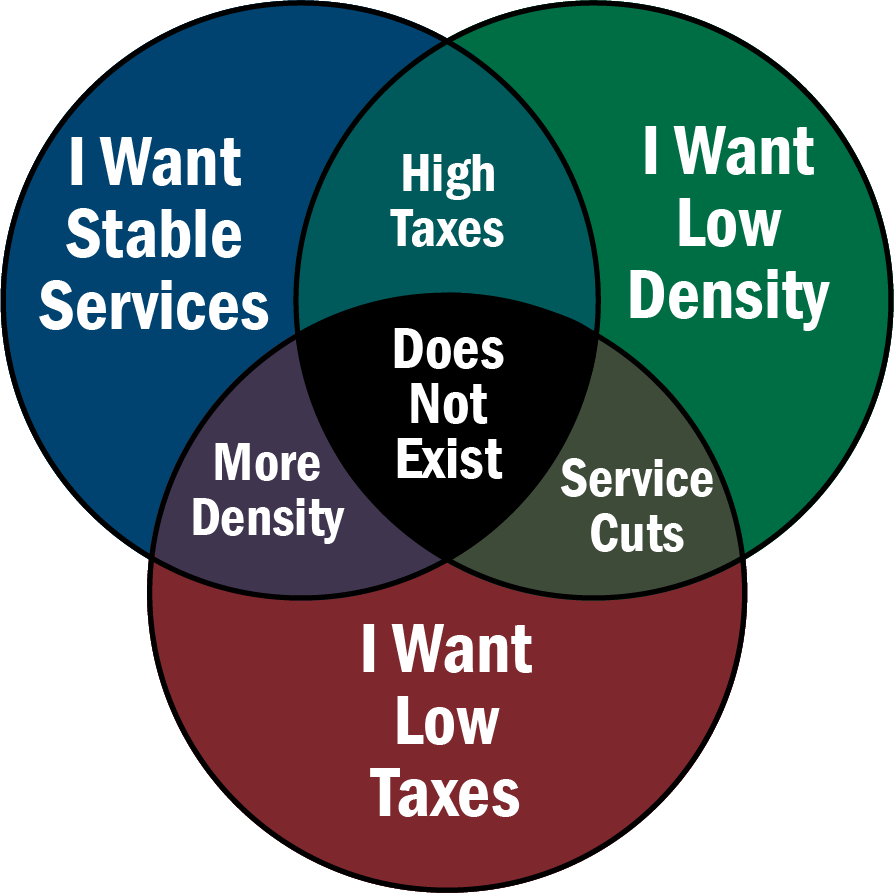
In 1970 Bloomington had 210 street miles of road maintenance obligations, by 2010 that number went up to 415 street miles.1 If you divide residents per mile for each date, 1970 would have 200 residents per street mile and in 2010 only 185 residents per street mile. That’s fewer taxpayers per section of street, mind you with heavier and more vehicle traffic than we had in the 1970s. No wonder road conditions are a top item for resident complaints. We need to think of roads as liabilities–a promise to upkeep forever–instead of capital assets that could be liquidated. Perhaps that will challenge future greenfield development that won’t pay for itself. The Venn diagram below is important to note for Bloomington.
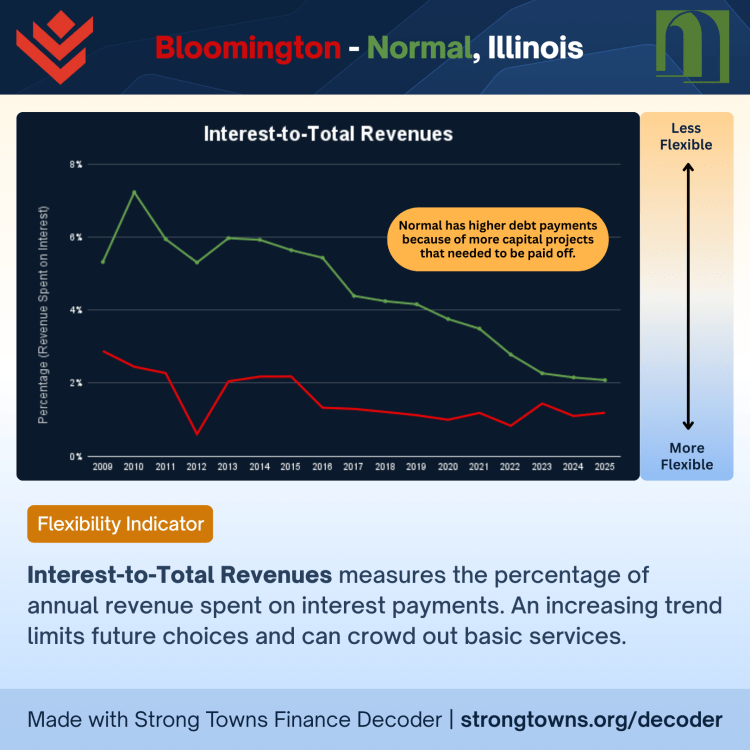
As for the Town of Normal, the higher percentage of the revenues paid for interest payments and other financial metrics appear worse than Bloomington on some of the charts. Normal has done comparatively more than Bloomington in efforts for redevelopment of downtown Normal into the destination it is today, “Uptown.” The New Urbanist mantra of walkability and placemaking are noble causes and a better agenda to spend on than endless sprawling subdivisions (which Normal also has a ton of), but this is where Strong Towns and the New Urbanists diverge.
The built form of Uptown has a lot to love about it, but it was all centrally planned from the beginning: Uptown Station, the Children’s’ Discovery Museum, and 1 Uptown Circle were all large projects that were championed by the municipal government. Funding for the newly green-lit $32 million ($14.9 million from Town funds) future underpass too is par for the course in Normal politics. These finance decoders are a tool that can help Normal steer Uptown development away from massive city projects funded via debt, tax-increases, and outside money to more of a bottom-up approach that we at Strong Towns prefer. (More on this in a future post).
Process
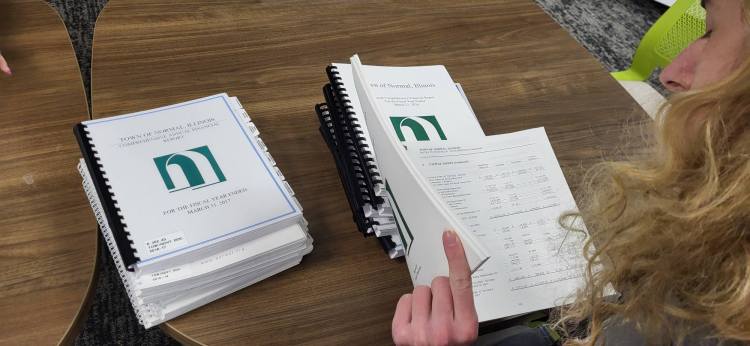
These ACFRs are publicly available on the websites of Bloomington and Normal, as well as older copies that sit in the reference sections of each respective municipality’s library. We had volunteers grab numbers from various sections in these standardized reports using instructions and videos from the national Strong Towns organization.
This information was double-checked by our team, but if you find a discrepancy, please contact us!

Check out the data yourself: Google Sheet Link
- Bring it on Bloomington! 2015 Comprehensive Plan ↩︎
